

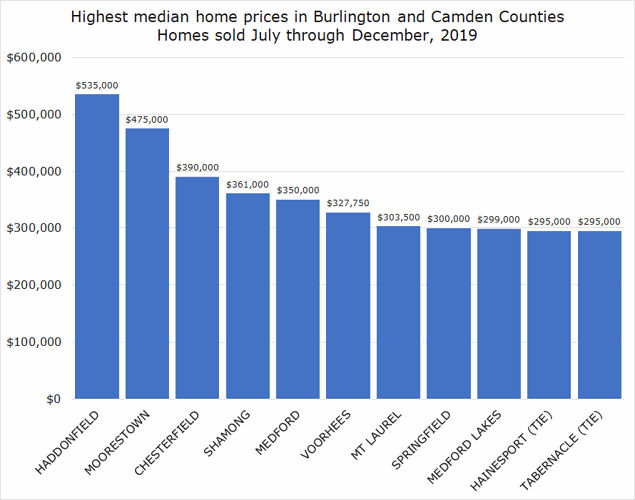

The borough of Haddonfield is the quintessential small town with beautiful tree-lined streets. It's so popular, the median home price in the second half of 2019 ranked it highest in South Jersey (outside of the Shore communities). The median home price there was $535,000 out of 138 sales.
The 70and73 Home Price Report is based on a twice-yearly analysis. The next one is scheduled for late summer. Do you have thoughts on the information or facts you'd like to see? Please let us know at contactus@70and73.com.
Median home prices in 148 South Jersey communities mostly increased in the last six months of 2019 compared with the same period in 2018, according to a 70and73.com analysis.
The median sale price was up in 69% of the communities, according to data on each sale provided to the New Jersey Division of Taxation by individual counties. However, the numbers of sales were down in about 58% of the communities. The analysis is based on more than 15,000 home sales. Condominiums are not included in this analysis.
Detailed price and other sales information for communities in South Jersey appears in the table at the end of this article. Some non-price statistics on homes sold in 70and73 Land and some neighboring communities in the last six months of 2019:
- Cherry Hill, the median house size among those sold was 2,038 square feet (living space) and the median age of the homes sold was 57 years.
- Evesham/Marlton, median size of 1,971 square feet and median age of 35 years.
- Medford, median size of 2,294 square feet and median age of 41 years.
- Medford Lakes, median size of 1,824 square feet and median age of 59 years.
- Mount Laurel, median size of 2,099 square feet and median age of 33 years.
- Voorhees, median size of 2,495 square feet and median age of 35 years.
- Moorestown, median size of 2,576 square feet and median age of 62 years.
- Haddonfield, median size of 2,083 square feet and median age of 91 years.
- Lumberton, median size of 1,659 square feet and median age of 31 years.
- Shamong, median size of 2,462 square feet and median age of 34 years.
- Southampton, median size of 1,360 square feet and median age of 43 years.
- Tabernacle, median size of 2,150 square feet and median age of 41 years.
Although median sale prices by community offer a good notion of price trends, the data still are subject to fluctuations. For example, if the number of homes sold was low in one year or if a type of home was popular one year compared to the year before, the data can be skewed. Median home prices reported here are for homes that sold for $50,000 or more and do not include condominiums. Calculations of price per square foot were made only when the living space for a given home was reported with the sale.


South Jersey Home Prices
Based on a 70and73.com analysis of more than 18,000 properties sold, as reported to the state by each county. Comparisons are July-December 2019 versus July-December 2018. These statistics do not include condominiums.
SOUTH JERSEY HOME PRICES IN LAST 6 MONTHS OF 2019 AGAINST 2018 SAME PERIOD (NON-CONDO) | © 70and73.com
| | 19 MED. PRICE | CHG. FROM 18 | 19 MED. PER SQ. FT. | CHG. FROM 18 | HOMES SOLD | CHG. FROM 18 |
|---|---|---|---|---|---|---|
| > BURLINGTON | ||||||
| BASS RIVER | $168,250 | 19% | $120 | 49% | 12 | 20% |
| BEVERLY | $137,000 | 28% | $94 | 44% | 22 | -39% |
| BORDENTOWN C | $220,500 | 4% | $133 | -5% | 32 | -20% |
| BORDENTOWN T | $273,950 | 7% | $150 | -7% | 84 | 42% |
| BURLINGTON C | $129,450 | 8% | $82 | 3% | 100 | -1% |
| BURLINGTON T | $248,750 | 5% | $142 | 9% | 200 | 4% |
| CHESTERFIELD | $390,000 | -3% | $153 | -2% | 49 | 23% |
| CINNAMINSON | $280,000 | 4% | $144 | 4% | 138 | -6% |
| DELANCO | $188,450 | -6% | $122 | 3% | 52 | 21% |
| DELRAN | $237,750 | 3% | $141 | 6% | 120 | -16% |
| EASTAMPTON | $265,000 | -1% | $133 | -1% | 46 | -13% |
| EDGEWATER PK | $193,000 | 13% | $111 | 2% | 47 | -28% |
| EVESHAM | $282,500 | 9% | $143 | 4% | 388 | -10% |
| FLORENCE | $193,000 | 5% | $123 | 4% | 129 | 6% |
| HAINESPORT | $295,000 | 6% | $153 | 2% | 53 | -10% |
| LUMBERTON | $213,950 | -13% | $128 | -5% | 110 | 3% |
| MANSFIELD | $255,000 | -4% | $150 | 3% | 103 | -4% |
| MAPLE SHADE | $175,000 | 4% | $131 | 9% | 122 | -8% |
| MEDFORD | $350,000 | 0% | $149 | 4% | 211 | -8% |
| MEDFORD LAKES | $299,000 | 10% | $162 | 4% | 60 | 33% |
| MOORESTOWN | $475,000 | 0% | $196 | 2% | 183 | 10% |
| MT HOLLY | $149,450 | 6% | $103 | -3% | 116 | 21% |
| MT LAUREL | $303,500 | 13% | $154 | 3% | 360 | 1% |
| PALMYRA | $169,000 | 20% | $128 | 37% | 59 | -24% |
| PEMBERTON B | $182,000 | -23% | $98 | -11% | 13 | 0% |
| PEMBERTON T | $159,900 | 11% | $119 | 12% | 261 | -1% |
| RIVERSIDE | $129,900 | -7% | $94 | 9% | 81 | 29% |
| RIVERTON | $289,000 | 14% | $162 | 13% | 15 | -29% |
| SHAMONG | $361,000 | 20% | $145 | 9% | 53 | -17% |
| SOUTHAMPTON | $184,950 | 3% | $130 | 3% | 162 | -5% |
| SPRINGFIELD | $300,000 | 5% | $121 | -19% | 25 | 14% |
| TABERNACLE | $295,000 | 7% | $134 | -3% | 61 | 11% |
| WESTAMPTON | $235,000 | 9% | $126 | -0.1% | 81 | -16% |
| WILLINGBORO | $160,000 | 25% | $90 | 25% | 412 | -13% |
| WOODLAND | $223,000 | -11% | $121 | -17% | 13 | 18% |
| > CAMDEN | ||||||
| AUDUBON | $185,000 | -2% | $133 | -3% | 81 | -29% |
| BARRINGTON | $190,000 | 10% | $126 | 7% | 71 | -1% |
| BELLMAWR | $154,000 | 9% | $114 | 1% | 129 | 6% |
| BERLIN B | $225,000 | 12% | $125 | 7% | 78 | 3% |
| BERLIN T | $172,550 | 14% | $122 | -3% | 60 | -2% |
| CAMDEN | $82,500 | 0.4% | $64 | 0.2% | 110 | -14% |
| CHERRY HILL | $275,000 | 9% | $138 | 4% | 502 | -22% |
| CHESILHURST | $162,000 | 8% | $103 | -1% | 19 | 27% |
| CLEMENTON | $136,500 | 2% | $101 | 12% | 34 | -24% |
| COLLINGSWOOD | $233,000 | 4% | $157 | -2% | 122 | -13% |
| GIBBSBORO | $224,900 | 22% | $117 | -1% | 27 | 4% |
| GLOUCESTER C | $102,255 | 2% | $78 | 10% | 92 | 15% |
| GLOUCESTER T | $170,000 | 5% | $105 | 7% | 548 | -19% |
| HADDON | $226,000 | -8% | $163 | 3% | 113 | -21% |
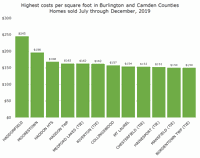
| HADDONFIELD | $535,000 | 13% | $245 | 2% | 138 | -19% |
| HADDON HTS | $278,000 | 13% | $168 | 4% | 73 | 1% |
| LAUREL SPR | $159,950 | -8% | $84 | -22% | 18 | 6% |
| LAWNSIDE | $150,000 | 43% | $95 | 56% | 22 | 47% |
| LINDENWOLD | $114,950 | -0.04% | $88 | 2% | 90 | -27% |
| MAGNOLIA | $145,000 | -3% | $115 | -5% | 41 | -28% |
| MERCHANTVILLE | $213,500 | 23% | $111 | 11% | 33 | -21% |
| MT EPHRAIM | $150,500 | 3% | $112 | 8% | 42 | -21% |
| OAKLYN | $177,500 | 5% | $140 | 5% | 48 | -25% |
| PENNSAUKEN | $145,000 | 7% | $101 | 3% | 320 | -1% |
| PINE HILL | $140,000 | 12% | $108 | 12% | 66 | -37% |
| RUNNEMEDE | $160,000 | 15% | $113 | 12% | 61 | -26% |
| SOMERDALE | $160,000 | 6% | $118 | 6% | 61 | -15% |
| STRATFORD | $170,000 | 13% | $105 | 7% | 53 | -18% |
| VOORHEES | $327,750 | 15% | $132 | 0.1% | 192 | -13% |
| WATERFORD | $165,450 | 8% | $108 | 20% | 96 | -24% |
| WINSLOW | $180,000 | 9% | $99 | 7% | 392 | -18% |
| WOODLYNNE | $70,000 | 0% | $62 | 14% | 15 | 36% |
| > ATLANTIC | ||||||
| ABSECON | $179,000 | 13% | $103 | -1% | 87 | -16% |
| ATLANTIC CITY | $112,125 | 7% | $75 | 14% | 164 | 8% |
| BRIGANTINE | $330,000 | 2% | $192 | -2% | 181 | 1% |
| BUENA | $140,000 | -3% | $94 | -16% | 42 | 20% |
| BUENA VISTA | $144,200 | -2% | $93 | 1% | 43 | -28% |
| EGG HARBOR C | $129,950 | 3% | $80 | -6% | 48 | 41% |
| EGG HARBOR T | $219,200 | 12% | $114 | 7% | 376 | -9% |
| ESTELL MANOR | $215,000 | 29% | $140 | 39% | 11 | 0% |
| FOLSOM | $137,000 | 1% | $82 | -13% | 17 | -19% |
| GALLOWAY | $206,500 | 10% | $113 | 7% | 270 | -12% |
| HAMILTON | $180,000 | 0.03% | $109 | 4% | 206 | 12% |
| HAMMONTON | $196,500 | 8% | $121 | 6% | 98 | 13% |
| LINWOOD | $230,000 | -2% | $147 | 12% | 61 | -27% |
| LONGPORT | $995,000 | -18% | $522 | -4% | 25 | 25% |
| MARGATE | $540,000 | 2% | $288 | -3% | 126 | -5% |
| MULLICA | $187,500 | 5% | $122 | 6% | 38 | -10% |
| NORTHFIELD | $168,000 | 2% | $110 | -1% | 77 | -14% |
| PLEASANTVILLE | $129,450 | 18% | $89 | 9% | 166 | 52% |
| SOMERS POINT | $187,500 | 10% | $136 | 9% | 89 | -7% |
| VENTNOR | $280,000 | 6% | $171 | 14% | 126 | -28% |
| WEYMOUTH | $187,500 | 70% | $132 | 89% | 16 | 45% |
| > CAPE MAY | ||||||
| AVALON | $1,800,000 | -3% | $803 | 9% | 95 | -10% |
| CAPE MAY | $807,000 | 28% | $440 | 7% | 59 | 2% |
| CAPE MAY PT | $758,500 | 26% | $497 | 19% | 12 | -14% |
| DENNIS | $185,000 | -4% | $123 | -13% | 72 | 41% |
| LOWER | $217,000 | 6% | $190 | 8% | 379 | -9% |
| MIDDLE | $214,900 | 10% | $145 | 9% | 187 | -18% |
| N WILDWOOD | $375,000 | 1% | $248 | 4% | 75 | 25% |
| OCEAN | $663,125 | -1% | $380 | 12% | 214 | -9% |
| SEA ISLE | $897,500 | 9% | $541 | -26% | 20 | 0% |
| STONE HARBOR | $2,077,000 | 4% | $1,066 | 14% | 42 | -31% |
| UPPER | $268,750 | 3% | $154 | 3% | 128 | -4% |
| W CAPE MAY | $535,000 | -2% | $335 | 9% | 17 | 6% |
| W WILDWOOD | $224,500 | 16% | $206 | 73% | 20 | -9% |
| WILDWOOD | $196,500 | 7% | $140 | 0% | 52 | -30% |
| WILDWOOD CR | $405,500 | 16% | $252 | 18% | 52 | -22% |
| > CUMBERLAND | ||||||
| BRIDGETON | $98,975 | 5% | $67 | -6% | 81 | 27% |
| COMMERCIAL | $106,500 | -5% | $89 | -3% | 20 | 33% |
| DEERFIELD | $167,450 | 10% | $111 | 1% | 22 | 29% |
| FAIRFIELD | $112,725 | 13% | $89 | -8% | 15 | 0% |
| HOPEWELL | $162,500 | 9% | $103 | -3% | 30 | -6% |
| LAWRENCE | $135,000 | -27% | $108 | -20% | 25 | 4% |
| MAURICE RIVER | $145,950 | -9% | $112 | 16% | 16 | 14% |
| MILLVILLE | $144,500 | 9% | $96 | 2% | 182 | 1% |
| U DEERFIELD | $165,000 | -1% | $115 | 26% | 43 | -9% |
| VINELAND | $148,250 | -2% | $100 | 0.4% | 380 | -1% |
| > GLOUCESTER | ||||||
| CLAYTON | $139,000 | -2% | $100 | 0.1% | 89 | 0% |
| DEPTFORD | $185,000 | 9% | $119 | 6% | 278 | 3% |
| E GREENWICH | $267,000 | 7% | $129 | 2% | 115 | 2% |
| ELK | $175,000 | -16% | $111 | -2% | 27 | -18% |
| FRANKLIN | $177,500 | 1% | $111 | 7% | 118 | -21% |
| GLASSBORO | $184,444 | -0.3% | $112 | -1% | 172 | 8% |
| GREENWICH | $169,000 | 13% | $108 | 9% | 55 | -7% |
| HARRISON | $368,438 | 12% | $138 | 5% | 104 | -3% |
| LOGAN | $191,000 | 0% | $130 | 2% | 45 | -37% |
| MANTUA | $199,950 | 0% | $125 | 3% | 126 | 2% |
| MONROE | $197,900 | 16% | $108 | 7% | 389 | 13% |
| NATIONAL PK | $130,000 | -8% | $97 | -15% | 29 | -29% |
| NEWFIELD | $139,950 | -9% | $116 | 17% | 22 | 38% |
| PAULSBORO | $104,750 | -1% | $77 | 13% | 50 | 16% |
| PITMAN | $171,000 | 6% | $116 | 0% | 91 | -17% |
| S HARRISON | $347,000 | 8% | $134 | 11% | 30 | 25% |
| SWEDESBORO | $162,900 | -2% | $99 | 1% | 23 | -26% |
| WASHINGTON | $230,000 | 5% | $118 | 6% | 420 | -1% |
| WENONAH | $238,500 | 4% | $122 | -3% | 29 | 71% |
| W DEPTFORD | $185,000 | 6% | $118 | 4% | 147 | -14% |
| WESTVILLE | $125,840 | 3% | $82 | -3% | 47 | 18% |
| WOODBURY | $130,000 | -0.2% | $85 | 11% | 108 | 13% |
| WOODBURY HTS | $165,000 | -5% | $102 | 9% | 22 | -37% |
| WOOLWICH | $323,000 | 2% | $124 | 2% | 103 | 3% |
| > SALEM | ||||||
| ALLOWAY | $196,550 | -12% | $112 | 6% | 20 | 18% |
| CARNEYS PT | $130,000 | 10% | $97 | 16% | 67 | 6% |
| ELMER | $125,000 | -29% | $78 | -18% | 15 | 15% |
| OLDMANS | $152,000 | -39% | $134 | 19% | 11 | -8% |
| PENNS GROVE | $70,000 | -23% | $47 | -15% | 17 | 70% |
| PENNSVILLE | $126,005 | 6% | $89 | 14% | 157 | 33% |
| PILESGROVE | $190,000 | -27% | $91 | -19% | 28 | -28% |
| PITTSGROVE | $191,826 | -11% | $121 | 13% | 59 | 9% |
| QUINTON | $147,000 | 14% | $108 | 19% | 20 | 33% |
| U PITTSGROVE | $212,500 | 15% | NA | NA | 14 | -13% |
| WOODSTOWN | $197,500 | 28% | $114 | 24% | 30 | -3% |


